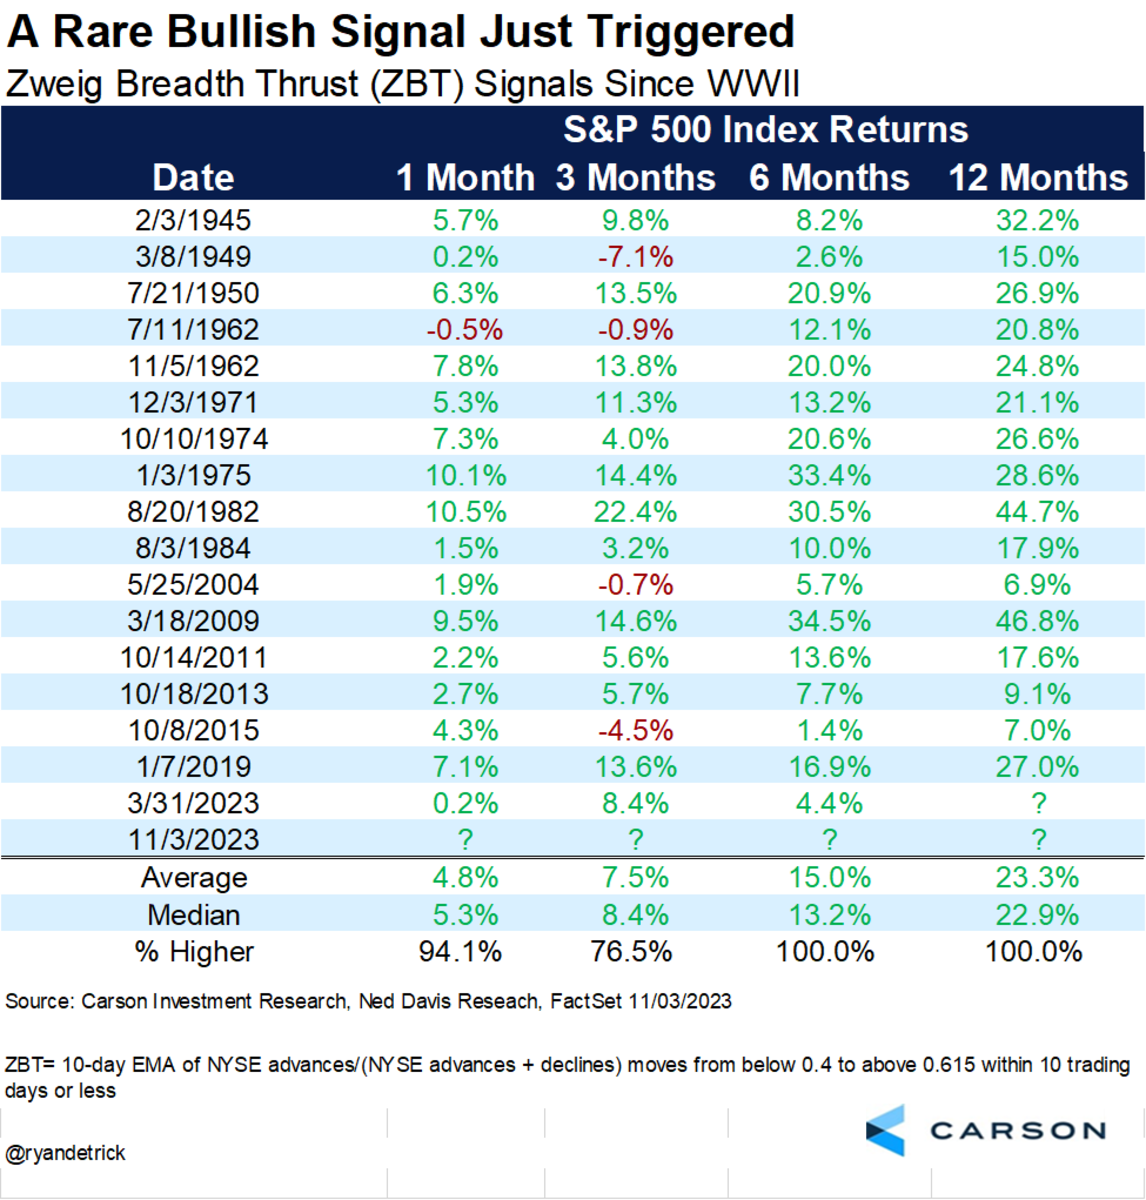
US stock market has thurst up rapidly this week.
The Zweig Breadth Thrust is derived from the ratio of advancing stocks to the total number of advancing and declining stocks on the New York Stock Exchange (NYSE). The indicator is calculated using a 10-day exponential moving average (EMA) of this ratio.
The Breadth Thrust Indicator was developed by Martin Zweig,. According to Zweig, the concept is based on the principle that the sudden change of money in the investment markets elevates stocks and signals increased liquidity. In other words, this indicator is all about how quickly the NYSE's advancing and declining numbers go from poor to great in a compressed time period.
Based on the 10-day EMA of NYSE Advances/(Advances+Declines), a bullish signal occurs when ZBT moves from below .40 to above .615 in 10 days or less. This very rare and usually indicates that this correction is over and we should turn bullish now.
https://schrts.co/KZwmGviA...
